The bottom line
Connecting to power is now the hard part of building compute. The three markets we score are each blocked by something different.
The moment
Every corridor is being repriced.
Attacks on shipping in the Strait of Hormuz hit their worst level of the war this month, cutting oil flows on 11 October to 2.9 million barrels against a pre-war 17.1 million a day.6 Europe heads into winter with gas near €83/MWh, its highest since early 2023, and storage still well below seasonal norms.7 Grid connection is now the binding constraint on data centers: Texas's grid operator is weighing about 474 GW of new demand, over five times the state's record peak and roughly 90% of it data centers,8 while FERC approved PJM's registry for large loads but rejected its proposed curtailment rules.9 Trade routes are healing unevenly — Suez container capacity passed half of pre-crisis levels for the first time since the Houthi attacks began,10 as Greece moves to restart surveys for the Crete–Cyprus power cable.11 Wherever you move cargo, develop assets, or insure either: the map under your decisions moved this year.
Verified as of 19 October 2026 · numbered links go to each source
Who it serves
Built for the teams making corridor decisions
The same physical system underwrites very different decisions. InfraTrack serves the three teams that have to be right about it.
Investment & Corp Dev
Decide which infrastructure projects are credible enough to build a position, a bid, or a partnership around — status, ownership, funding turns, and dependencies verified against sources, not press releases.
Strategy & Intelligence
Keep the house view current: what actually changed since your last review, what it re-prices, and which developments deserve a place on the leadership agenda next quarter.
Risk & Leadership
See the constraints that delay or derail projects — permits, grid connections, water, security events at chokepoints — early enough to adjust exposure rather than explain it afterwards.
What it answers
The questions InfraTrack answers
- Which projects are credible? Status and ownership verified per asset, with the date we checked.
- What changed since the last review? Funding, control, schedule, and security developments — source-linked.
- What constraints could delay the project? Permitting, grid interconnection, water, opposition, chokepoint exposure.
- Which assets, counterparties, and events should be watched? A named watchlist, not a data dump.
- What does the change mean for your decision? Analyst interpretation in your context — the part a database can't do.
What you can buy
Three ways to engage — for any corridor, anywhere
Every engagement is scoped to the decision it has to support. Fixed scope, quoted after a short scoping call — no subscription required to start.
Corridor Brief
One-off · issued in days
A written decision brief on the corridor your decision depends on.
- 10–15 page brief on your corridor window
- Custom watchlist of projects, assets and counterparties
- Status, ownership, dependency and risk review per item
- Full source appendix — every claim traceable
- 45-minute walkthrough, one revision round
- One 30-day change update
Corridor Monitor
Ongoing · after a first brief
Your brief kept current, built on the watchlist from your first brief.
- Quarterly re-issued brief with changes since the last issue
- Material-change notes between issues — financing, ownership, permits, schedule, security
- Every change sourced and dated, with an analyst read on what it means
- Watchlist reviewed at each issue
Site Screen
One-off · issued in days
Speed-to-Power scoring for the regions or sites you are weighing.
- Speed-to-Power score per candidate, with all five components shown
- Binding-constraint check — a blocked grid connection caps the score
- Water stress, documented opposition and generation within the radius
- Sourced evidence table and a 45-minute walkthrough
Evidence first
Read a sample before you talk to us
Condensed samples of the two written products — the structure, scoring, maps and sourcing every engagement delivers, whichever corridor or region yours covers.
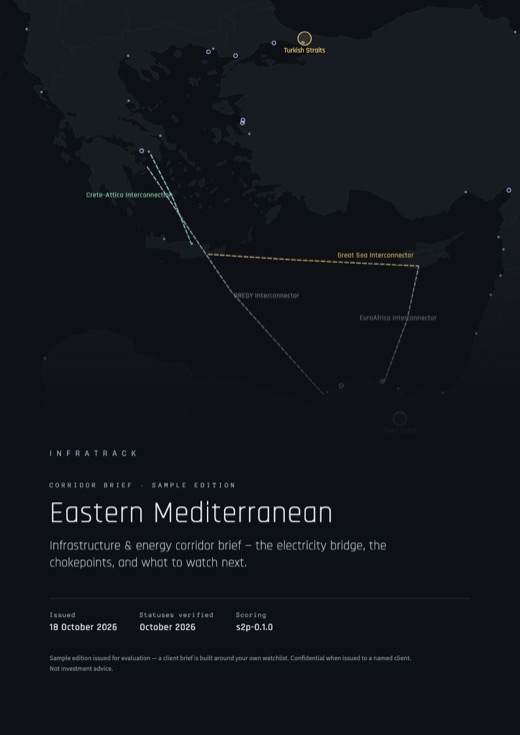
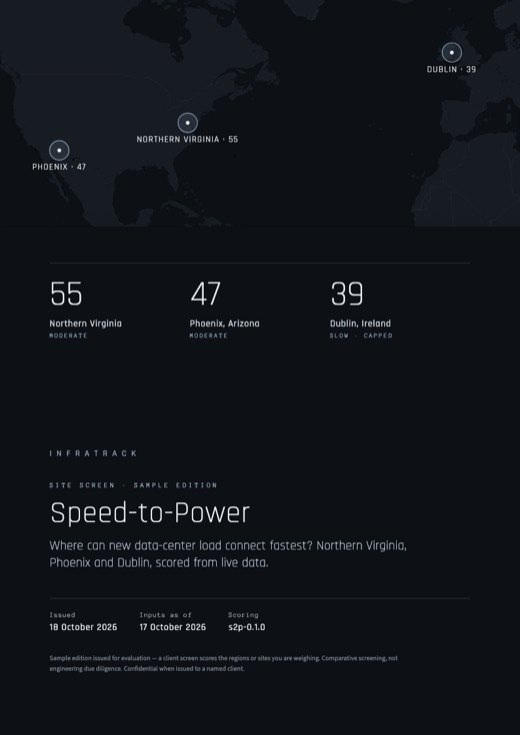
Samples issued October 2026. Statuses and sources verified as of October 2026; client deliverables are re-verified in the week of issuance.
The engagement
How it works
- Define the decisionA 30-minute scoping call: your corridor window, exposure, and the decision the brief must support.
- Build the watchlistWe name the projects, assets, counterparties, and events that actually bear on it.
- Review evidenceStatus, ownership, dependencies, and the constraints that could delay each item — verified against sources.
- Receive the briefThe written product plus a 45-minute walkthrough, with one revision round.
- Monitor changesA 30-day change update is included; ongoing monitoring is scoped from your watchlist.
The principle
Every statement sourced, checked and dated
Every number in InfraTrack exposes its components, weights, data vintage and scoring version. Every curated item lists the sources behind it, and in October 2026 each one was checked against the text of those sources: statements no source supports were removed, wrong dates and figures corrected, and "confirmed" is used only when an operator, police force or court has confirmed the event. Every claim must rest on a primary document, peer-reviewed research or established press — the build refuses to publish anything that doesn't. The product tells you when each item was last checked rather than calling itself real-time.
What changed and when · Full methodology, sources and licenses
The compute vertical
Speed-to-Power — where can new load actually connect?
The same scoring engine, pointed at a different question: how fast can a region actually take new AI or industrial load?
Our counterintuitive finding
Dublin has the best fundamentals of the three markets, and it still ranks last. It beats both US markets on water (80) and permitting (80), and a plain weighted sum would rate it 71, which is Fast. But Dublin's grid is entirely constrained for new data centers,12 and our method treats a binding constraint as binding: the score is capped at 39, Slow. Phoenix outranks it at 47, even though all 63 of its mapped data centers sit in extremely high water stress. Water stress raises what a project costs. A closed grid stops it. Switch the cap off below and Dublin comes first under most weightings.
Set your own weights
Scores under your weights
Northern Virginia, Phoenix, and Dublin are scored publicly as the engine's proof: see the cluster comparison or Dublin's gating constraint on the live map. Or screen your own site: drop a pin anywhere and get an indicative score from the same method.
Provenance
Who is behind this
The analyst
Vassilis Konstantinou — NYU Master's research on energy security & geopolitics. Analysis and curation are one person's accountable judgment, with the methodology published for inspection. Family roots in Eastern-Mediterranean shipping and logistics — Emvélia.
The data
Global Energy Monitor · US NGA World Port Index · WRI Aqueduct 4.0 · World Bank Open Data · OpenStreetMap · Natural Earth · Wikidata · own verified event compilations. Every dataset passes a license-and-attribution gate before it can ship.
The discipline
Versioned scores (current: s2p-0.1.0), per-item "as of" dates, and verification tags on every curated event. Corridor statuses and sources verified as of October 2026; the signal feed shows its own update date. Nothing here is claimed to be real-time.
Begin
Request a corridor brief
Request a pilot brief — or book a scoping conversation first. Pricing is scoped to your corridor and decision. Tell us about it; we reply within one business day.